LAS Celebrates 10 Years

The Laboratory for Analytic Sciences highlights 10 projects with national security impact as it marks a decade of research collaboration between government, industry and academia.
It’s no secret that NC State University is the flagship STEM institution of North Carolina, home to innovative researchers and cutting-edge labs. We lead a rich and diverse set of research centers and institutes, including a National Science Foundation funded artificial intelligence institute; and our proximity to the Research Triangle Park, a focal point for science and business, provides an economic ecosystem for collaboration with novel tech companies.
When the National Security Agency sought to create a cross-sector, interdisciplinary data analysis laboratory to address the growing complexities of big data, they zeroed in on Raleigh, North Carolina. NC State was ready to report for duty.
It was a massive undertaking to establish a lab that would support the intelligence community with analysis, but in 2013, the Laboratory for Analytic Sciences (LAS) opened on NC State’s Centennial Campus as a partnership between the university and the NSA.
Over the past 10 years, the lab has grown from eight to more than 50 full time employees, deployed $86 million in funding to 61 partner organizations, and conducted 460 research projects in the pursuit of revolutionizing the art and science of intelligence analysis.
What a difference a decade makes. On Monday, May 15, LAS will celebrate its 10th anniversary with a cake-cutting ceremony. From studying analysts’ daily workflows to improving human-machine teaming, LAS’s research has evolved, but the mission remains the same: developing innovative technology and tradecraft that has a direct impact on national security.
| Sci and Spy: Terms to Know |
|---|
| Tradecraft: The processes, tools and skills used for intelligence gathering. |
The following 10 projects reflect LAS’s technological innovation; impact on national security; improvements to intelligence analysis; and collaborative nature between industry, government and academia.
Related: The History of LAS
Challenge, Meet Solution: 10 LAS Projects with Mission Impact
1. An App that Watches You Work, Then Makes Suggestions (Journaling, 2014)
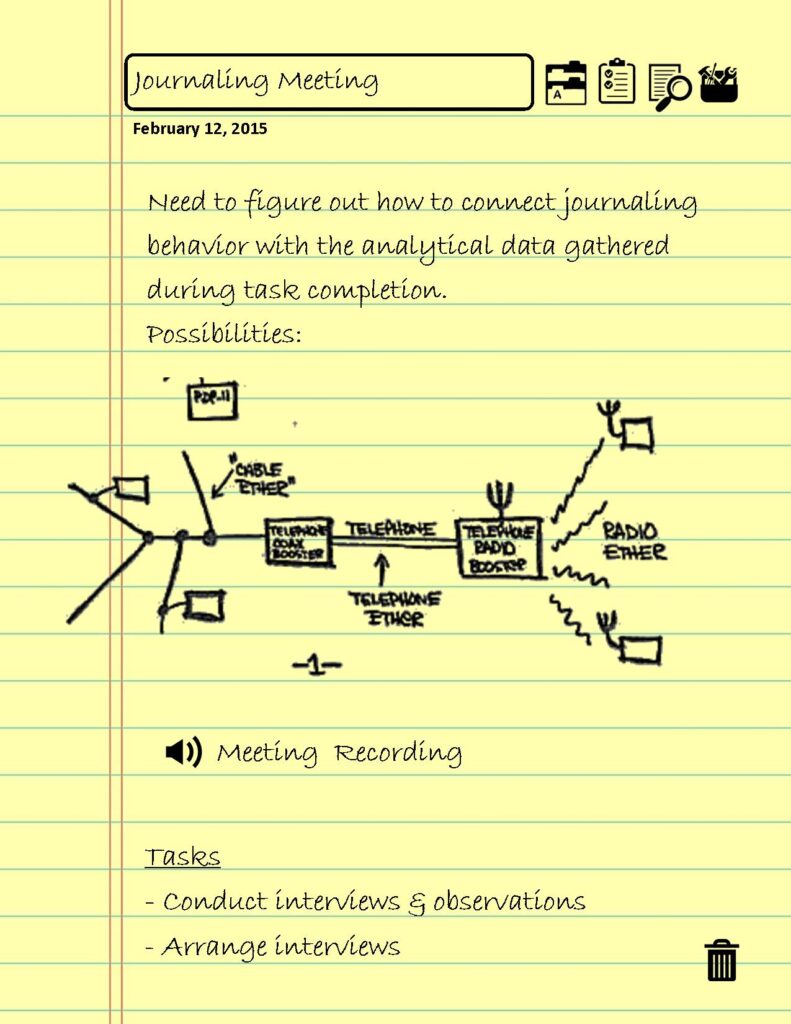
Understanding how individuals and teams make sense of information, accomplish tasks, and develop workflows can improve analytic tradecraft and confidence in intelligence products. The web-based Journaling application prototype records user work patterns, such as what resources are used, how often, and for how long. This data can be used to automatically generate activity reports about workflows. Beyond capturing simple time on task, the end goal of the Journaling app is to understand the (goal-based) activities users are engaging with, while they leverage other resources and software. When paired with novel recommendation software (a separate LAS research and development project), the Journaling app could be able to suggest resources that would help an intelligence analyst approach a problem, whether it be via datasets, articles, or other strategies. The Journaling app was a precursor for research conducted at LAS’s inaugural Summer Conference on Applied Data Science in 2022.
2. Identifying Potential Disruptions at the Olympics (RASOR, 2016)
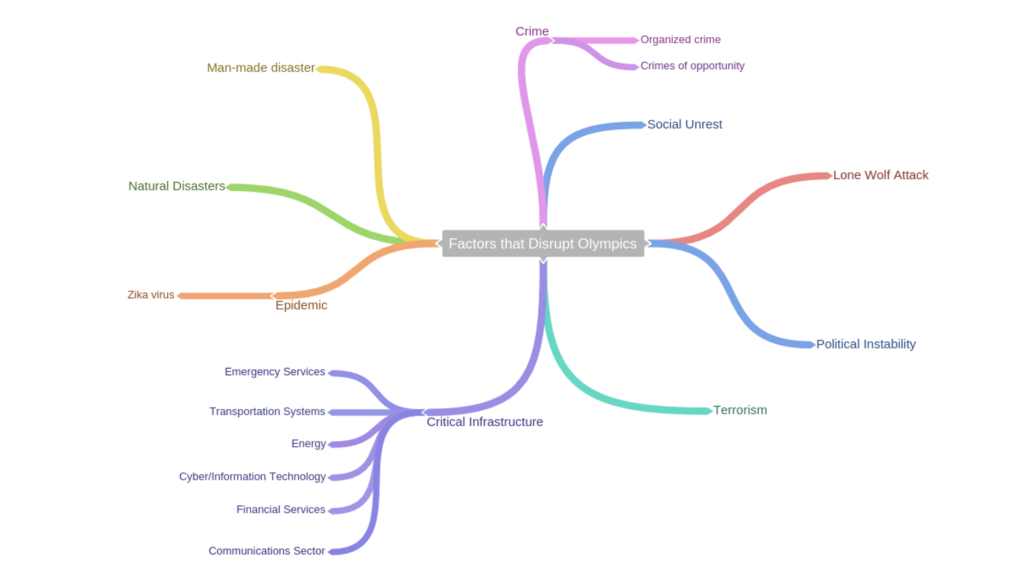
In 2016, LAS received a National Intelligence Meritorious Unit Citation from the Office of the Director of National Intelligence (ODNI) for the development and integration of data analysis technologies and tradecrafts to warn of emerging threats during the Summer Olympic Games in Rio de Janeiro, Brazil.
LAS provided support for the Olympics through RASOR (Research in Activity in Support of the Summer Olympics in Rio), a project that analyzed big data to discover potential disruptions to large events. Leading up to the Olympics, Brazil was experiencing significant social unrest, with multiple marches and riots occurring daily throughout the country. LAS’s work enhanced the safety of Olympics attendees by using publicly available information to predict in real-time the locations of large-scale public demonstrations around Rio. Software created by LAS connected traffic information from bus and train services in real time, alerting officials to potential safety issues for athletes and attendees during the influx of protests.
“The environment was truly collaborative,” says an LAS analyst involved in the project. “We did some things that we’d never done before – we combined government, commercial and academia capabilities with publicly available information and internal data, in real time, and within a matter of months. That was a monumental effort. The collaboration was happening from so many different locations. In the end it really came together.”
3. Enriching Open Source Data (OpenKE, 2016)
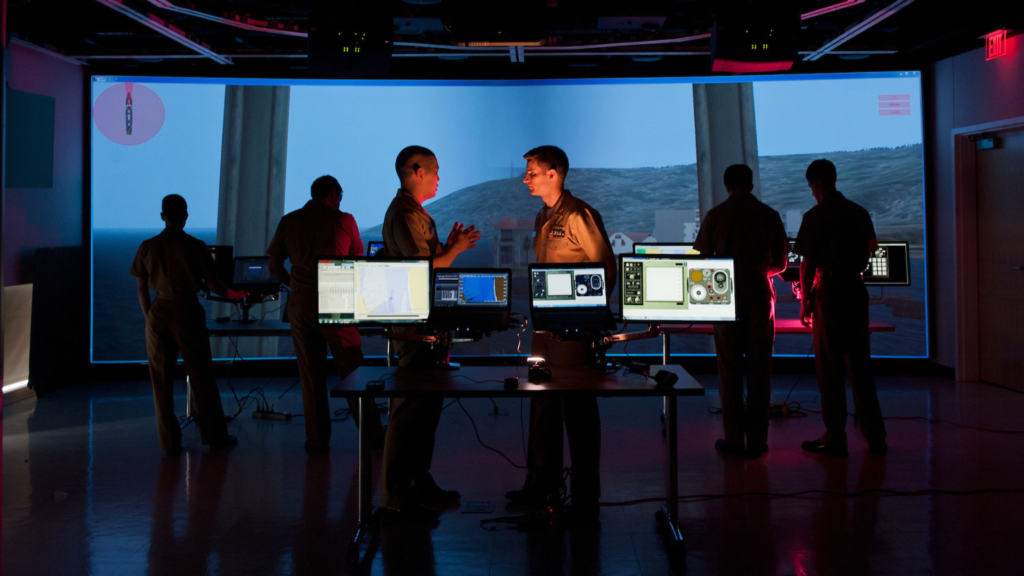
Synthesizing publicly available information into a national security workspace is complex. It involves collecting, formatting and analyzing open source data available on the Internet. The Open Source Knowledge Enrichment (OpenKE) platform developed at LAS provides an unclassified environment in which users can apply analytics that help manage these complexities. The platform provides targeted search capabilities to find relevant information and then augments the retrieved information through a variety of analytics. The system is designed to be semi-automated and able to scan a wide range of structured and unstructured data sources to help analysts view all relevant information.
| Sci and Spy: Terms to Know |
|---|
| Open Source Data: Data that is freely available for the public to access, use, and share. |
| Unstructured Data: Compared to information stored in fielded database form, unstructured data is unorganized information such as text, photos or videos. |
4. Understanding Risk Factors for Terrorism Involvement (Radicalization, 2017)

To gain insight into terrorist attacks across the globe, LAS researchers collaborated with the psychology department to apply psychological methods and tools to discover predictors of political, social, or religious terrorism involvement. By studying previously published literature on terrorism involvement, researchers identified nine correlates of terrorism involvement.
“We gathered and curated all we could from literature published on radicalization,” says Christine Brugh, a research scholar at LAS. “We consolidated it down to critical insights to share with our counterterrorism analysts.”
The literature review revealed gaps in evidence but also an increasing diversity in the methods used to study terrorism. Researchers have moved away from a “one-size-fits all” approach to explain why individuals participate in terrorism. LAS researchers continued this line of investigation through quantitative study of women involved in terrorism and application of a risk assessment framework to U.S. and European lone actor terrorists.
“Strengthening existing partnerships and creating new collaborations between the academic and intelligence communities and policymakers is a first step towards counterterrorism policy that is both practical and empirically supported,” Brugh says.
5. Revolutionizing the Speed and Integrity of Data Collaboration (Great Expectations, 2018)
Great Expectations, a software product that helps data engineers detect problems in data pipelines, officially launched at the Strata Data Conference in New York after beginning as a collaboration at LAS. James Campbell, an LAS government employee at the time, recalls asking Abe Gong, a friend who was working in health care data: “Wouldn’t it be great if we could put unit tests for data into functions and documentation, particularly to support models that we were sharing with other teams?” The two founded Great Expectations, which provides software tools to simplify running tests against incoming data, allowing engineers to be alerted to potential data issues before they impact customers. The company has since raised over $60 million in funding and employs over 50 staff across the United States.
“You want your data systems to become complex,” says Campbell. “Instead of thinking about ways to simplify the data system, you should instead think about ways to manage the complexity.”
6. Optimizing Hardware Usage for Big Data Analytics (TuningWolf, 2018)
To interpret a large set of data, intelligence analysts will run analytics, which takes time and uses a lot of computing resources. NC State computer science senior design students involved in the TuningWolf project used a massive publicly-available weather data set, which included a year’s worth of daily weather information collected by weather sites across the country. They explored how to use machine learning to modify analytic parameters set at runtime, to return analytic results to analysts as quickly as possible while minimizing the needed computing resources. The goal of this project was to automate the tuning and resource selection at runtime. The student team ultimately reduced the resource allocation while also decreasing the runtime by an average of about 40%.
7. Labeling Data to Improve Search Results (Infinitypool, 2019)

Infinitypool is a data labeling software prototype. Labeled data is needed for many machine learning tasks, but collecting it is boring and tedious, and, particularly for government applications, often requires specialized expertise held by busy analysts. Infinitypool makes it easy for analysts to contribute to crowdsourced labeling efforts during moments of free time. It’s collaborative (teams can unite across geographies), gamified (achievement badges and scoreboards motivate teams during repetitive tasks), and compliant with data access regulations.
Infinitypool helps data scientists explore and find new ways to test and apply machine learning to solve various challenges faced by the intelligence community. It also saves time.
“Infinitypool encourages data discovery while enabling project- and data-level authorizations which together encourages machine learning reliability and repeatability,” says an LAS analyst involved with the project. “It’s designed to come alongside existing machine learning workflows to provide human-in-the-loop data triage and data validation capabilities.”
As of 2023, Infinitypool is in use at multiple government agencies.
Related: Infinitypool: Model-Assisted Labeling
8. Discovering Relationships in Data (RedThread, 2021)
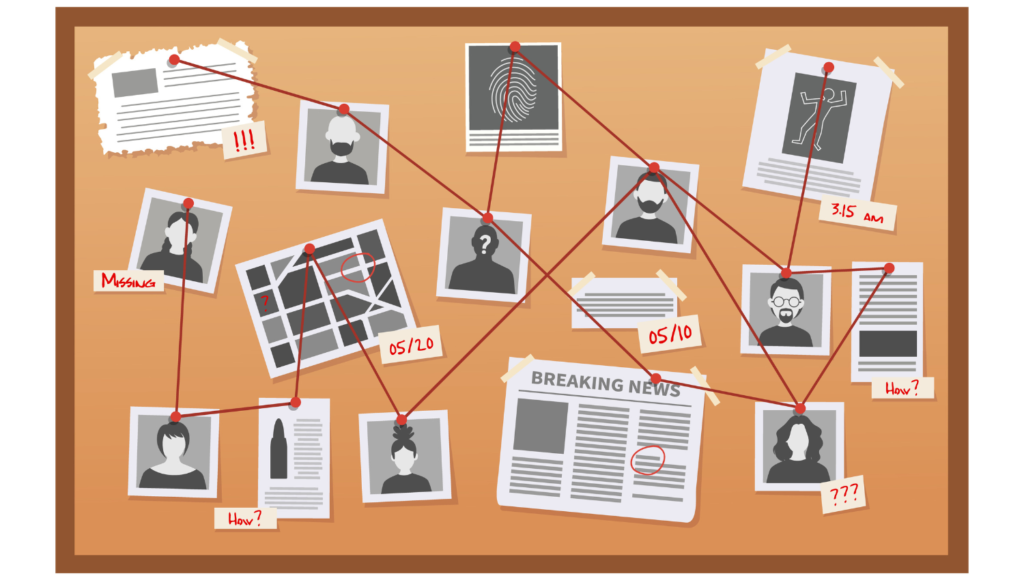
Your favorite detective movie likely has a scene where the investigators are gathered at a cork board, linking suspects and events to each other with red yarn to help solve a mystery. Or maybe your grandmother gave you a framed copy of the family tree. Both of these are examples of knowledge graphs – a way of storing and organizing complex, interrelated data that enables faster and smarter querying. A knowledge graph has two core elements: 1. A graph-structure that 2. displays relationships between data objects. LAS’s RedThread project develops machine automated ways to populate a knowledge graph from unstructured data, such as news articles or intelligence reports, so the data can be understood and manipulated more easily by intelligence analysts.
Extracting information in a more efficient manner and representing it as a knowledge graph enables intelligence analysts to draw conclusions from the information that may have otherwise been missed.
| Sci and Spy: Terms to Know |
|---|
| Knowledge Graph: A visual display of relationships between entities that can be understood by humans and computers. |
Related: Using Design Thinking to Investigate the Potential of Knowledge Graphs
9. Using the Nixon Tapes to Improve Workflow (PandaJam, 2022)
| Sci and Spy: Terms to Know |
|---|
| The Nixon White House tapes: President Richard Nixon secretly recorded roughly 3,700 hours of conversations and meetings between 1971 and 1973 using a sound-activated system. Approximately 70 hours of these recordings were used at the Watergate trials, the major political scandal that led to Nixon’s resignation. |
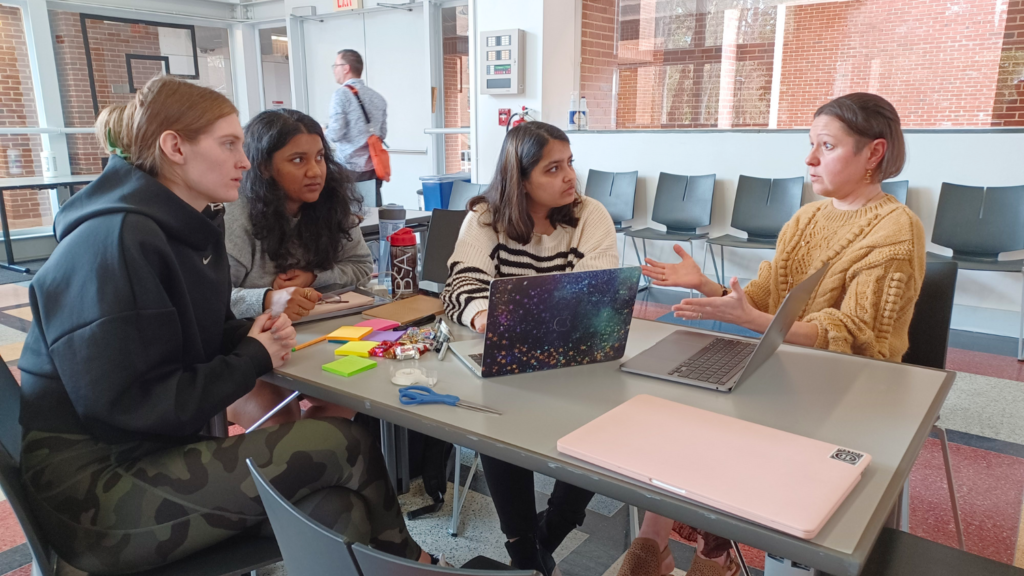
The 3,000+ hours of President Richard Nixon’s surreptitiously-recorded conversations provide a known body of data on which to test how an analyst might search for information. Artificial intelligence systems can develop a greater understanding of humans’ cognitive processes by observing a user’s workflow as they complete a task. As a realistic proxy for what intelligence analysts do in their classified work, researchers involved with the PandaJam project at LAS asked analysts to search through the Nixon White House tape transcripts and answer questions about the pandas that China gifted to the US in 1972. By observing their search process, researchers could identify common pain points in their workflow.
The outcomes of the PandaJam study have important implications for technologists whose goal is to design and implement machine capabilities intended to augment the workflow of language analysts specifically, and of intelligence analysts in general.
10. Finding Rare Objects of Interest in Video Footage (EyeReckon, 2022)

| Sci and Spy: Terms to Know |
|---|
| CCTV: A closed-circuit television, also known as a video surveillance camera. |
| Synthetic data: Data that is artificially generated by a computer simulation rather than by real-world events. |
EyeReckon uses machine learning to help analysts discover intelligence value from large untrimmed video datasets. Research into detection of objects and actions of interest have been tailored for the needs of those in harm’s way. Whether it’s detection of politically affiliated flags, small objects like surveillance cameras that indicate a higher-crime area, or new threatening graffiti drawn on the side of a wall, EyeReckon wants to provide the analysts the tools they need to quickly search, find, and discover intelligence value.
In order to find these objects, computer vision models need training data, and lots of it. Because these objects are rare and limited in quantity, the training data needs to be supplemented by synthetic data. By algorithmically creating synthetic data, the cost and danger of collecting data is reduced, accuracy is increased, and privacy is protected.
Related: EYERECKON: Train Computer Vision Models to Detect Rare/Uncommon Objects
—
Hannah Moxey, Deborah Strange and Michelle Winemiller contributed to this article.
This post was originally published in Laboratory for Analytic Sciences.


