
By the Numbers
NC State is continuously recognized nationally for its strong commercialization activity that drives real-world impact.
Research commercialization metrics highlight the impact of university innovations as they move from the lab to the marketplace. By tracking invention disclosures, patents, licenses, and startup creation, these measures reflect how a university transforms research discoveries into real-world solutions that can drive both economic growth and societal benefit.
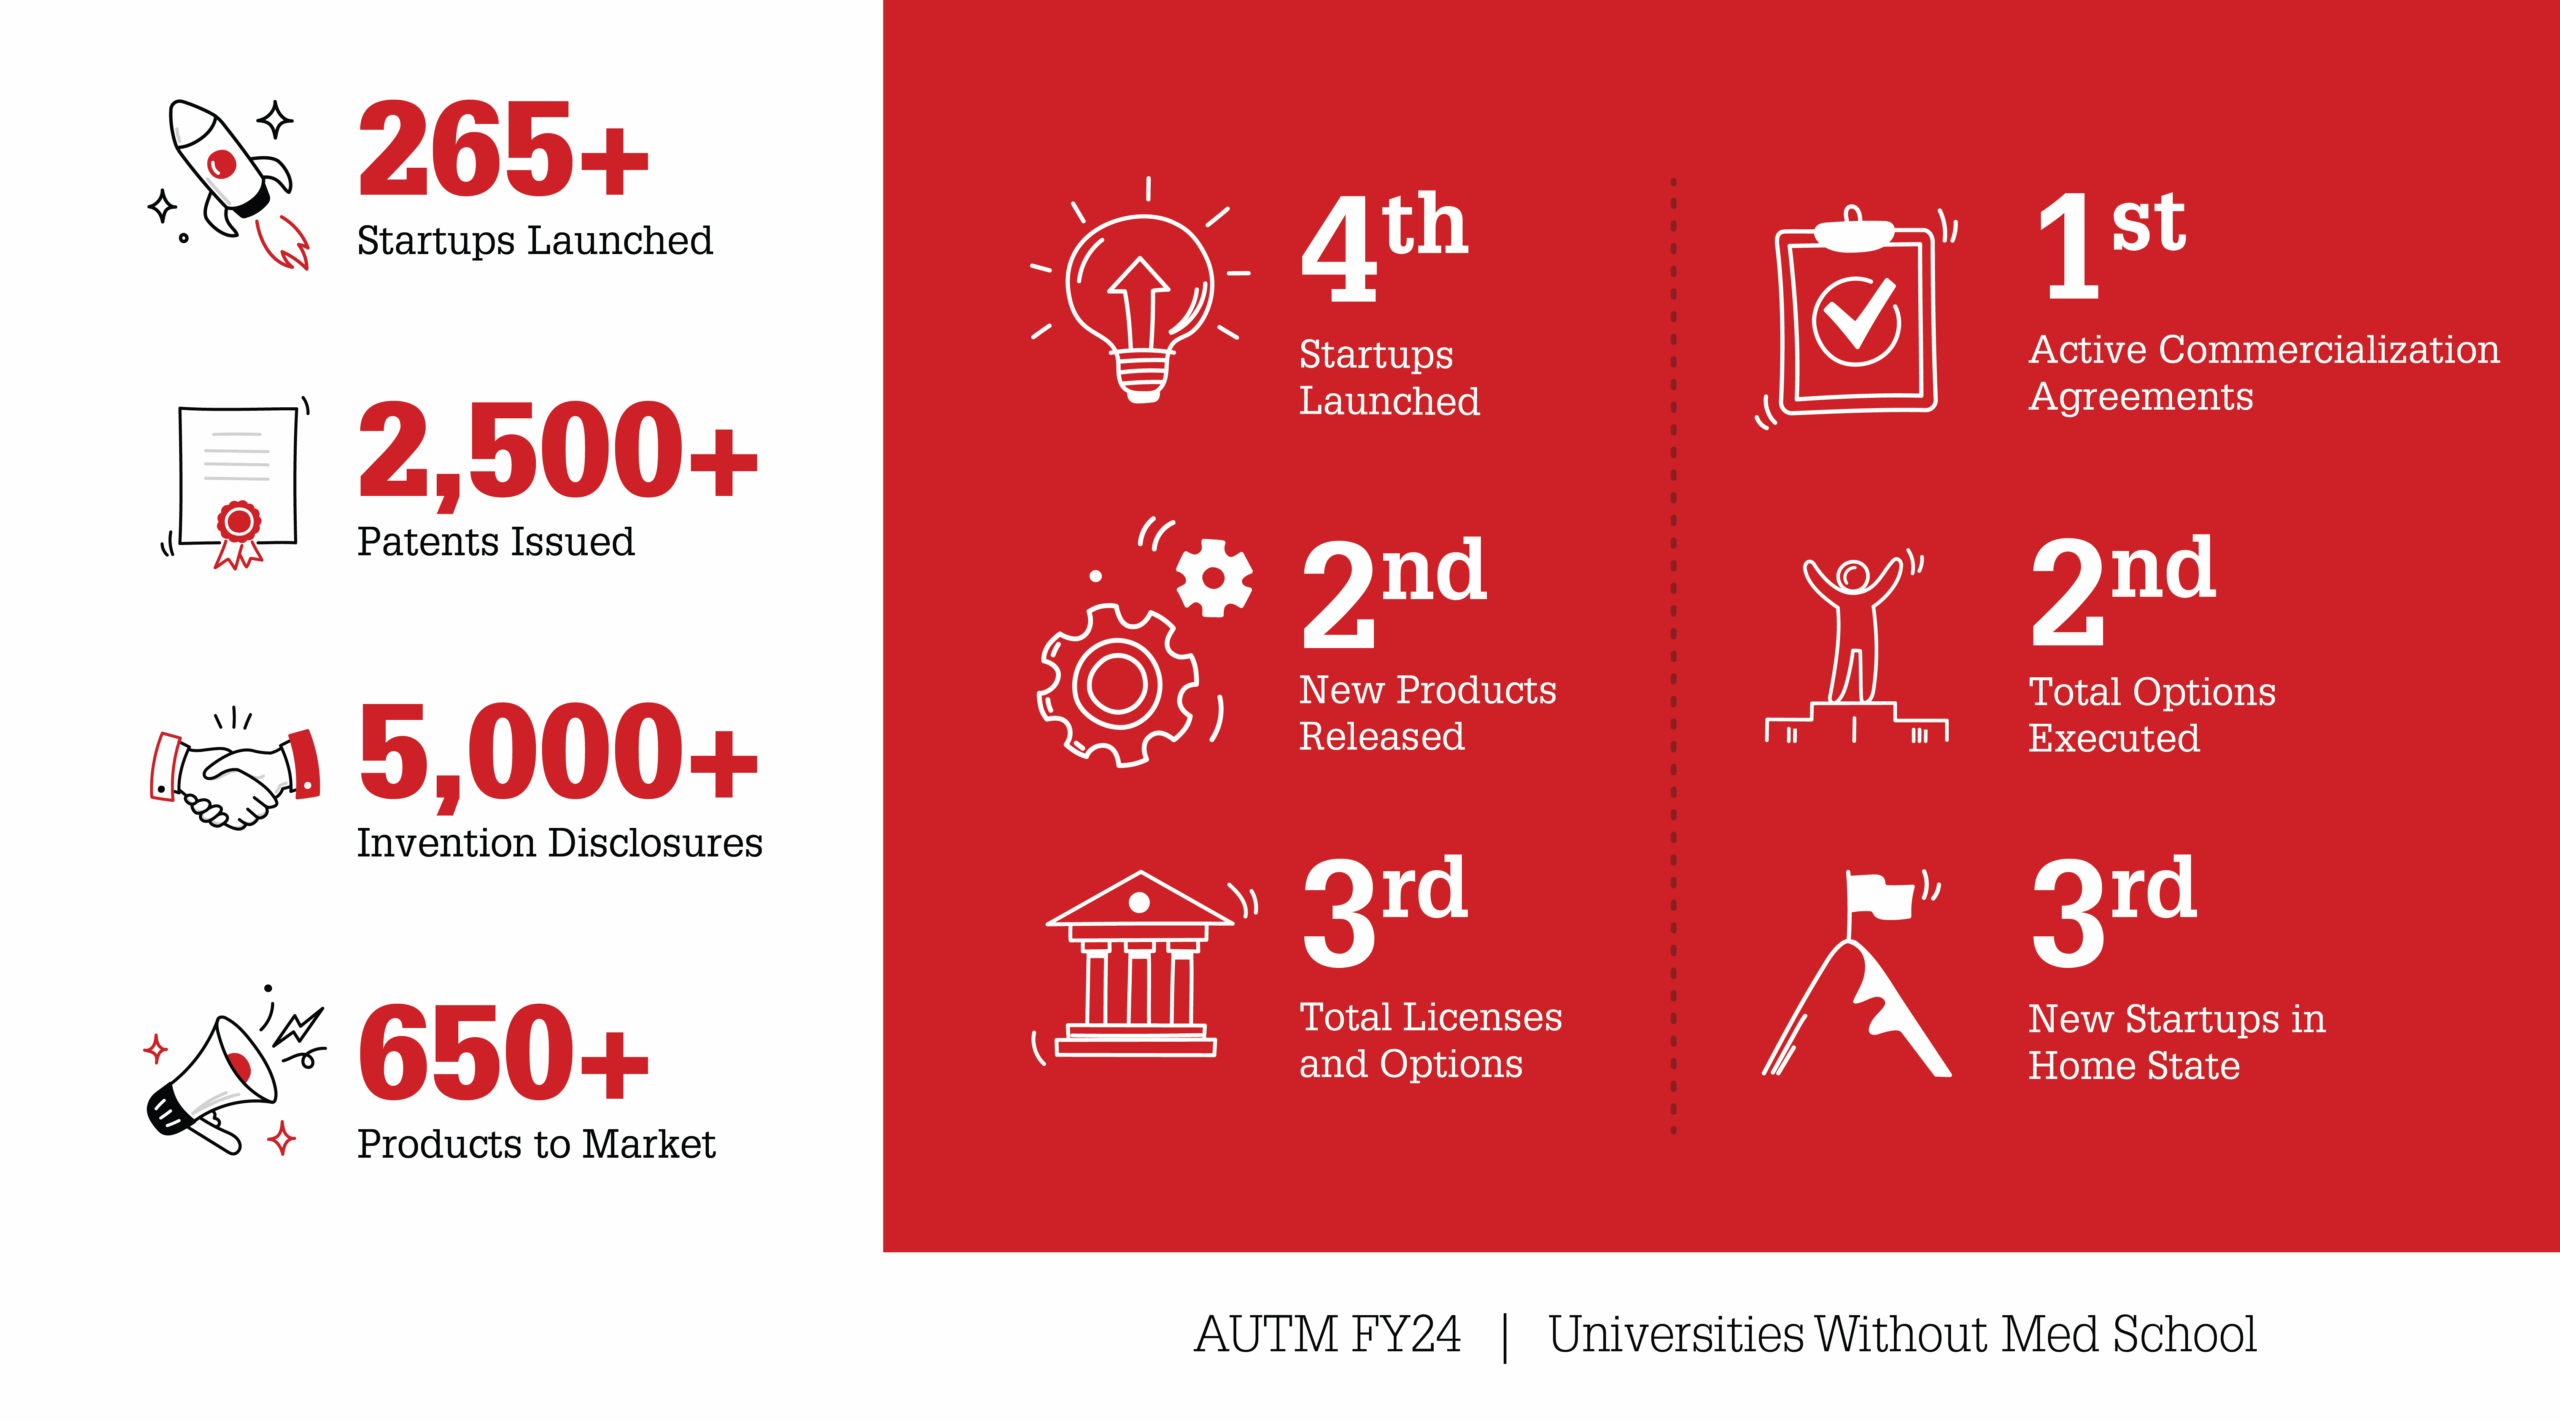
Stats & Rankings
NC State is a leading public research university — and the world is taking notice. See where we excel.
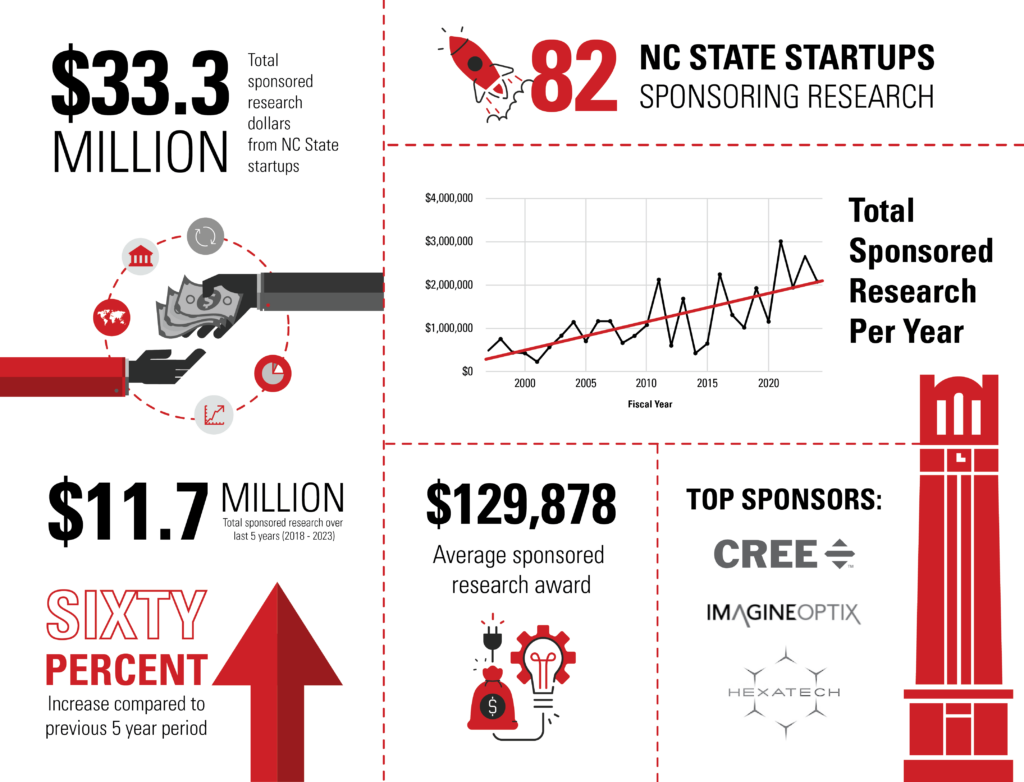
Startups Sponsoring Research
Startup companies spun out from NC State often sponsor research to further develop breakthrough innovations. These collaborations not only bring in external funding to the university but also create opportunities for applied research, student training, and real-world impact.
Five Year Metrics
| FY21 | FY22 | FY23 | FY24 | FY25 | |
|---|---|---|---|---|---|
| Disclosures | |||||
| Inventions | 186 | 163 | 159 | 163 | 151 |
| Software | 21 | 15 | 18 | 21 | 17 |
| Plant Variety | 38 | 24 | 10 | 23 | 28 |
| Copyright | 21 | 2 | 3 | 9 | 12 |
| Trademark | 2 | 0 | 0 | 0 | 1 |
| Tangible Research Material | 1 | 1 | 0 | 0 | 2 |
| Total | 269 | 205 | 190 | 216 | 211 |
| Patent Activity | |||||
| Total New Patents Filed | 258 | 260 | 269 | 248 | 243 |
| US Patents Issued | 53 | 54 | 44 | 60 | 52 |
| Foreign Patents Issued | 42 | 50 | 46 | 79 | 37 |
| Total Patents Issued | 95 | 104 | 90 | 139 | 89 |
| Commercialization Agreements | |||||
| Patent License | 32 | 25 | 31 | 30 | 29 |
| Software License | 6 | 17 | 10 | 9 | 6 |
| Plant License | 74 | 55 | 50 | 69 | 73 |
| Copyright License | 5 | 1 | 0 | 2 | 2 |
| Tangible Research Material License | 0 | 1 | 1 | 0 | 1 |
| Options | 82 | 91 | 48 | 45 | 101 |
| Total | 201 | 193 | 141 | 156 | 215 |
| Miscellaneous Agreements | |||||
| MTA | 222 | 254 | 258 | 189 | 202 |
| CDA | 429 | 400 | 343 | 354 | 337 |
| Other | 190 | 228 | 179 | 147 | 155 |
| Total | 841 | 882 | 780 | 690 | 694 |
| Revenue | |||||
| Royalties ($ millions) | $6 | $6.8 | $5.7 | $7.3 | $5.7 |
| New Venture Development | |||||
| Startup Companies | 20 | 18 | 14 | 15 | 14 |