Connecting Power and Place

For Bethany Cutts, faculty fellow at the Center for Geospatial Analytics and assistant professor in the Department of Parks, Recreation and Tourism Management at NC State University, environmental justice, urban ecology and spatial analysis go hand in hand. “I’m interested in the hidden geography of power and information, and the way that informs how urban environmental projects get done and who they benefit,” she says. Newly published research by Dr. Cutts and collaborators at the University of Illinois at Urbana-Champaign links interview responses and spatial analysis in the Milwaukee River watershed to produce new tools for understanding social vulnerability across time and space.
The research focused on the Milwaukee River, where legacy pollution from decades of agricultural and industrial activity prompted remediation efforts in the early 1980s and again in the early 2000s. “Watershed planning groups have proven to be effective allies of some of the most marginalized water resources,” Cutts says, and “government agencies and environmental groups have long recognized the need to be inclusive and reach diverse audiences.” Yet, these planning groups may also inadvertently overlook marginalized populations who are deeply impacted by environmental hazards and remediation efforts.
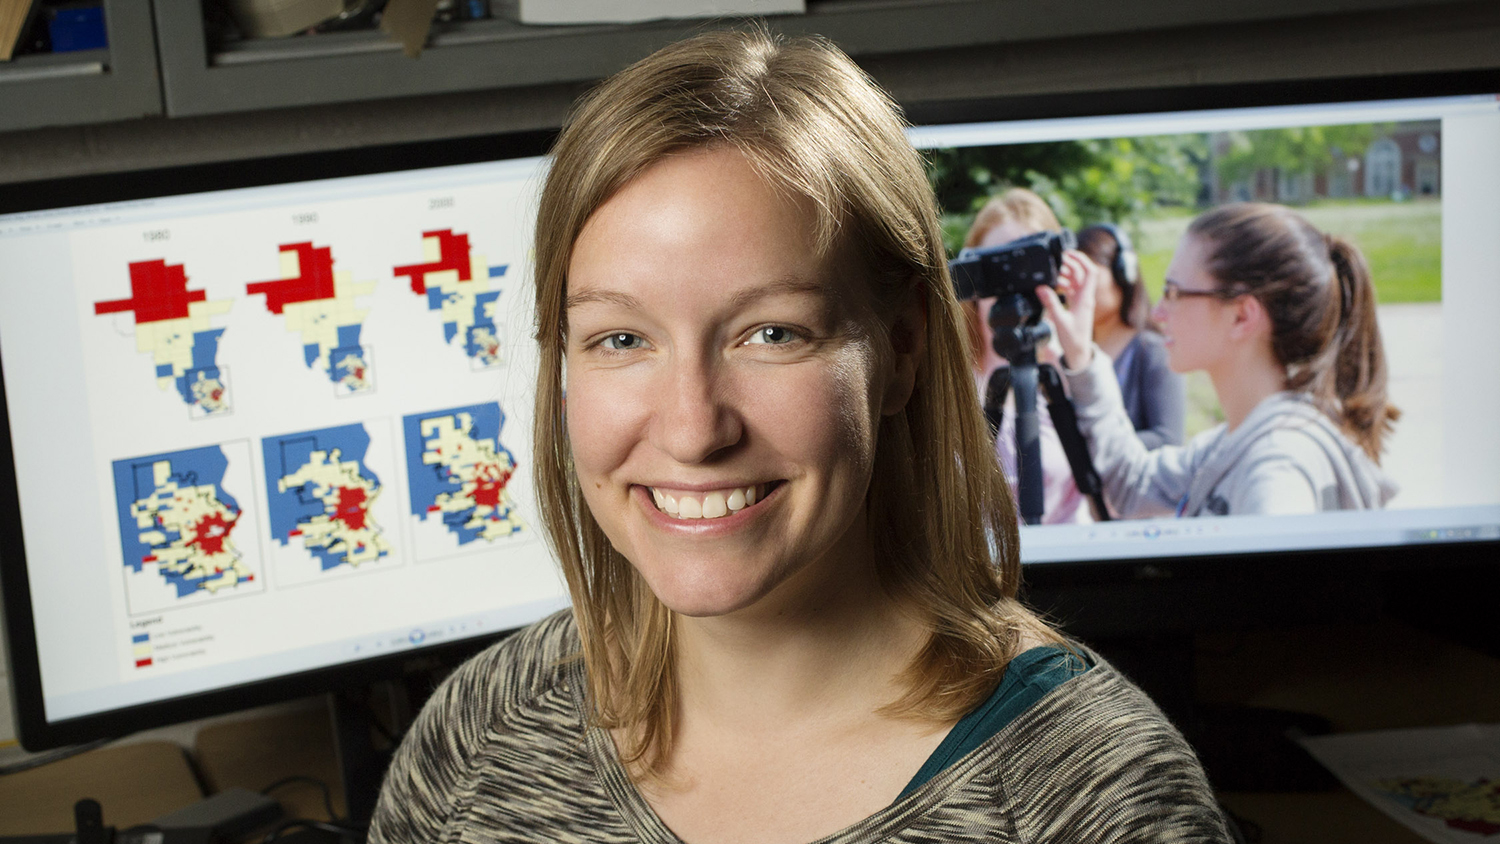
Cutts and her team, which included six master’s students, asked members of environmental non-governmental organizations (NGOs) and community NGOs, government officials, community leaders and Milwaukee residents questions about social groups they thought were vulnerable to environmental impacts. The results showed that planning groups “had a narrower perspective of who was vulnerable than representatives of the community at large,” Cutts says. She combined the insights from the interviews with established social vulnerability indices and a geographic information systems (GIS) mapping framework to identify vulnerable populations perhaps not served by current watershed planning.
Five different definitions of social vulnerability emerged from interview responses, and all could be explored spatially. “We can learn important things from GIS, but it’s helpful to have interviews or other data to help structure the analysis,” Cutts says. In particular, the analysis focused on “spatial clusters of social vulnerability,” or “areas where census tracts with high vulnerability are statistically more likely to be located near other high vulnerability tracts.” The work also highlighted the value of examining communities and their vulnerability over time. “There’s often a long time between the vision of a [remediation] project and when there are boots on the ground and shovels in the soil,” Cutts says. Community identity, vulnerability and demographics can all change over those long timeframes. “Environmental improvements have the potential to be a double-edged sword, enhancing environmental quality while also enabling displacement that exacerbates vulnerability.” Cutts’ approach explicitly includes “mapping out vulnerability to understand relationships.”
How will this work empower watershed planning groups in the future? The techniques that Cutts and her colleagues demonstrated enable planners to ask and answer more targeted questions about the communities in their watershed, such as “How close are clusters of high vulnerability to the locations of hazards or amenities?” “Which locations are consistently associated with high vulnerability over time?” “How have measurements of vulnerability changed over time in relation to the locations of watershed investments?” “What levels of vulnerability characterize the places where actively engaged stakeholders live and work?” And “Are the needs of highly vulnerable stakeholders being addressed?” among others.
“GIS work points to a different way to think about community over time and community identity,” Cutts says. Through community engagement and mapping, her approach can help well-intentioned planning groups expand their reach and co-realize greater benefits for the entire watershed.
This post was originally published in Center for Geospatial Analytics.


